Abstract

Recently, several proposals and discussions have tried to push the use of HTML for preparing and sharing research works within the scholarly domain. Therefore, several native HTML-based templates and formats have been introduced for allowing researchers to write scientific documents, which could be access even with assistive technologies, e.g., screen readers. While HTML can be a good basis for guaranteeing accessibility of such papers, several issues are still in place when we consider the inclusion of non-textual entities in the main text, such as complex formulas and figures. In this paper we experiment on the use of one of such HTML formats, i.e., the Research Articles in Simplified HTML (RASH) format, extended for creating accessible graphs automatically out of CSV data. In particular, we introduce an extension to RASH to let the creation of accessible graphs. Moreover, we analyze the outcomes of some preliminary experiments we have done by using different screen readers on several operating systems and browsers.

Introduction

Accessibility of Web content from users with disabilities is a well-known topic. Since the end of 1980's until now, Standardization entities (i.e. W3C, ISO ), associations, and governments (with the promulgation of laws and acts ) have defined standards and conducted several initiatives with the aim of supporting users with disabilities in accessing digital content and online services.

In this context, accessing scientific content is still a critical issue, in particular for visually impaired people. Major barriers are represented by the Portable Document Format (PDF), which is the standard de-facto format for scientific papers , by the presence of graphs and graphical information, used to vehicle aggregated data as results of investigation and research activities , and by other characteristic elements, according to the topic of the research (e.g. mathematical formulae, chemical diagrams, etc.) . Some studies in this field show that inaccessible PDFs are one of the major causes of frustration when screen readers users browse the Web . Some other works demonstrated that one of the main problems with the PDF format is a lack of knowledge or prioritization of accessibility by document authors . Authors should equip images and graphs in a document with a textual description. Some plugins and browser add-ons have been designed to support authors in equipping their content with adequate textual alternatives for the graphical information . Unfortunately, they are usually based on the idea of presenting a textual description of the graph elements, instead of presenting the elements at the basis of their meaning. As a result, we obtain that screen reader users could miss the real significance of that graph and the data it represents .

Providing a mechanism to facilitate the creation of accessible graphs in research articles is just the tip of an iceberg. Obtaining a more accessible format for conference proceedings and research papers could be a first step in the direction of making accessible learning and didactical materials of STEM (Science, Technology, Engineering and Mathematics) subjects. This would provide great benefits to scholars and students with visual impairments, from primary schools to Ph.D. programmes.

In this paper we presents an experiment that aimed at investigating how existing HTML-based markup languages for scientific documents and conference proceedings can be easily extended so as to enable the automatic generation of graphs from tabular data. In particular, we have extended the Research Article in Simplified HTML (RASH) format with two tools for automatically generating graphs from CSV documents. Such two RASH extensions are based on:

Thanks to such RASH extensions, two versions of the same document have been created, one written in RASH+evoGraphs, the other one by means of RASH+D3. Such documents contain six different graphs obtained from the same CSV data. Then, these documents have been tested by one of the authors of this paper, who is a screen reader user due to his visual impairments. He compared these two versions by means of the most commonly used combinations of operating systems, browsers and screen readers. The outcomes highlight that only the RASH+evoGraphs extension addressed all the tested accessibility-oriented requirements in a satisfactory manner.

The rest of the paper is structured as follows. presents some related work about the accessibility of PDF documents and the most common barriers that can be faced by visually impaired users in accessing scientific documents and conference proceedings. introduces RASH as the HTML-based format we used in our experiment. The integration of evoGraphs and D3 in RASH is explained in , as well as the experiments we have conducted and the discussion of the related outcomes. Finally, concludes the paper with some final remarks and future works.

The Research Articles in Simplified HTML Format

The Research Articles in Simplified HTML (RASH) format is a markup language that restricts the use of HTML to only 31 elements for writing academic research articles . In order to improve the user experience in terms of accessibility of such HTML-based papers, RASH reuses some items from the W3C Accessible Rich Internet Applications 1.1 . Moreover, it exploits several roles introduced in the Digital Publishing WAI-ARIA Module 1.0 , which allows digital publisher to apply the structural semantics they need to drive the authoring process while getting accessibility.

Concerning its theoretical foundations, RASH is entirely based on a strong theory on structural patterns for XML documents . The systematic use of these structural patterns is an added value in all stages of the documents’ lifecycle: they can be guidelines for creating well-engineered documents and vocabularies, rules to extract structural components from legacy documents, indicators to study to what extent documents share design principles and community guidelines.

From a development point of view, any RASH document begins as a simple (X)HTML5 document, by specifying the generic HTML DOCTYPE followed by the document html element. On the one hand, the head element of a RASH document must/should include some information about the paper, i.e., the paper title (title element), at least one author and other related information (i.e., affiliations, keywords, categories, by using the meta and link elements). On the other hand, the body element mainly contains textual elements (e.g., paragraphs, emphases, links, and quotations) for describing the content of the paper, and other structural elements (e.g., abstract, sections, references, and footnotes) used to organize the paper in appropriate blocks and to include specific complex structures (e.g., figures, formulas, listings, and tables).

RASH is accompanied by an extended Framework , which includes, in addition to the language, documentation and writing/conversion/extraction tools for facilitating to write and manage academic articles in RASH . Some of these tools are actually included in the RASH Online Conversion Service (ROCS) , which is a Python web application based on web.py that allows one to convert an ODT document (written according to the aforementioned guidelines) into RASH, and from RASH into LaTeX compliant with the most commonly used publisher formats.

Accessibility of Automatically-Generated Graphs

In this section, we present the outcomes of an experiment we prepared for assessing the quality of accessibility of automatically-generated graphs that visualize tabular information stored in CSV documents. To this end, we have created two different extensions of RASH: one based on evoGraphs , and another one based on D3 . introduces such extensions. In , we present the criteria that were used for measuring the accessibility each implementation provided, according to different operating systems, browsers, and screen readers. discusses the outcomes of our analysis.

Use of evoGraphs and D3 in RASH

We have developed two extensions of RASH in order to create automatically graphs starting from CSV documents. Our approach was to allow the use of CSV documents within a RASH file, without including any modification to the current implementation of RASH. We only considered a slightly extension of the language so as to allow to specify an @id attribute in any script element (with text/csv type) contained in the head element when needed. Thus, we identified two possible ways for including such CSV values within RASH documents. The first one concerns the use of an external CSV file by means of the @src attribute of the img element, when it is part of a figure box. The other alternative is to embed CSV rows within the RASH document itself by means of the script element (identified appropriately and specifying the CSV type) contained in the head element. This way, it can be possible to refer to such CSV content by means of a local URL specified in the @src attribute of the img element.

Independently from the particular structure chosen, the idea is that the img element should visualize the rendered graph (instead of the simple CSV values) according to a specific graph type (horizontal_bar_chart, vertical_bar_chart, pie_chart) specified by means of the @class attribute.

Given such premises, we extended the main RASH Javascript file so as to implement automatic graph generation from CSV documents, by using two different libraries for graphic visualization and rendering: evoGraphs and D3 . We involved in the experiments a team of developers with no skills and experiences in accessibility, who took care of implementing the two RASH extensions. This allowed us to evaluate the accessibility of the documents created according to such extensions, and, thus, to understand which proposed graphic tool was the most appropriate for creating accessible graphs without any prior knowledge on accessibility issues.

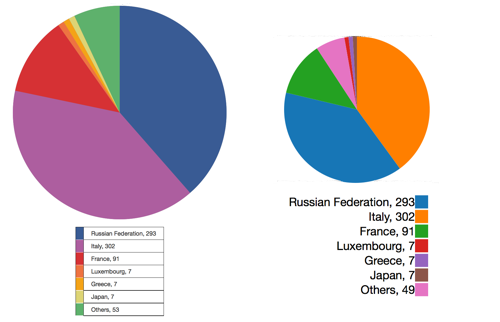
After implementing such extensions, we prepared two RASH documents (one for each extension) including six different automatically-generated graphs: a vertical bar chart, an horizontal bar chart, and a pie chart using both the approaches presented (external and embedded CSV documents). For instance, the HTML rendering of a pie chart using embedded CSV data is shown in . All the sources and the exemplar documents produced and used in the experiment introduced in the following of this paper are available at https://w3id.org/pleople/essepuntato/papers/rash-ads2017/experiment.html.

How the RASH extensions implemented with evoGraphs (on the left) and D3 (on the right) render in HTML a pie chart built from CSV data.

How the RASH extensions implemented with evoGraphs (on the left) and D3 (on the right) render in HTML a pie chart built from CSV data.

Experiment

Blind people have now access to a variety of devices running different operating systems and screen readers. Hence, detailed tests must be conducted to verify that the evaluated method works and to ensure that it gives consistent results on different platforms, through different browsers and by using different screen readers.

The choice of which components involving in the experiment has be done by including the most plausible scenarios where the proposed RASH extensions could be used in practice. Thus, we focused on desktop environments since a blind person would most likely use a computer for studying research documents and analyzing data in detail.

The main desktop operating systems offering accessibility support for blind people, either through native components or third party applications, are Chrome OS, Linux (in some of its flavors), Mac OS X and Microsoft Windows. According to statistics about the operating systems used by participants at the 6th Screen Reader Survey (conducted by WebAIM ), Linux was used in 1% of the submissions, while Chrome OS was never used. For this reason, we focused our experiment on the two most widely used desktop operating systems: Mac OS X and Microsoft Windows.

The screen reader available on Max OS X is VoiceOver. Since VoiceOver is a system component, being a part of the operating system, we used the latest stable Mac OS X version available at the time of conducting the experiment: OS X El Capitan version 10.11.3. Moreover, at the time of conducting our tests, the last stable Windows version was Windows 10, but this particular version shows several accessibility issues. For this reason, NVDA developers recommend blind users to avoid using Windows 10 . Considering this, we decided to use Windows 8.1, which provides a better support to accessibility. Regarding the Windows platform, we have chosen to use JAWS and NVDA, which are the most commonly used on Windows platforms . Thus, we used JAWS Professional Version 16 and NVDA 2016.1.

Since we were evaluating the accessibility of different methods to automatically create and embed graphs in HTML based documents, there was another key factor to take into account: the browser. In any operating system, a browser plays a key role in exposing information about the page structure and attributes to the operating system accessibility APIs (and consequently to screen readers). Since there are many different accessible browsers for the two operating systems we were considering, once again we needed to make some decisions to restrict the number of testing environments. We decided to evaluate the native browser of each operating system, i.e., Safari and Internet Explorer for Mac OS X and Microsoft Windows respectively. In addition to them, we decided to conduct our tests by means of Google Chrome, Opera, and Mozilla Firefox, because they currently are within the top five most popular web browsers for desktop operating systems . Unfortunately, Mozilla Firefox under Mac OS X has critical accessibility issues that prevent a blind person from using it proficiently, so we could not evaluate the two RASH extensions by using it in such platform.

Finally, we needed to establish what tests to run so as to decide which one of the two RASH extensions gives the best outcome in terms of accessibility. We decided to structure the tests as simple questions that could only be answered either positively (marked with “+” in the following tables if it applies to all graphs or, alternatively, listing the number of the figures for which the question is correctly answered), partially (marked with “~” in the following tables), or negatively (marked with “-“ in the following tables). Therefore, each test involved a particular RASH extension for answering the following questions (Q1-Q5 herein):

  1. Does [RASH extension] allow a blind person to understand which type of graph (pie chart, bar chart, etc.) is being represented?

  2. Using [RASH extension], is the data representation keyboard accessible?

  3. Are data represented by [RASH extension] readable using a screen reader?

  4. Using [RASH extension], does the data representation conveyed by the screen reader allow a blind person to understand data relevancy (e.g., data with a higher impact on the graph) as clearly as the visual representation of the graph does?

  5. Using [RASH extension], does the screen reader convey explicitly the relationship between data and the label that they relate to?

Each test has been run by a blind person (one of the authors of this paper), who is experienced in using multiple screen readers on different platforms, but the related results reflect the medium user behavior as suggested in .

Evaluation

, , and contain the outcomes of all the tests involving the aforementioned operating systems, browsers, and screen readers.

shows the outcomes of the tests involving Microsoft Windows 8.1 as operating system and JAWS as screen reader. The tests were run by using different web browsers: Internet Explorer, Mozilla Firefox, Google Chrome and Opera. As shown in the table, the RASH+evoGraphs extension (labelled as eG in the table) is significantly preferable over the D3 based one. In fact, while the former passed all tests, the latter it failed to address positively Q1, Q4, and Q5 – the latter one excepting figures 3 and 6 of the samples, i.e., the pie charts obtained by using both the methods introduced in . In addition, the RASH+D3 extension answered partially also Q2 about keyboard accessibility – i.e., the representation of the graph is not selectable using the tab key, while it works if arrows keys are used instead – except when using Internet Explorer as browser.

Test Explorer Firefox Chrome Opera

1 (D3)

-

-

-

-

1 (eG)

+

+

+

+

2 (D3)

+

~

~

~

2 (eG)

+

+

+

+

3 (D3)

+

+

+

+

3 (eG)

+

+

+

+

4 (D3)

-

-

-

-

4 (eG)

+

+

+

+

5 (D3)

3 and 6

3 and 6

3 and 6

3 and 6

5 (eG)

+

+

+

+

Microsoft Windows + JAWS

shows the outcomes of the tests involving Microsoft Windows 8.1 as operating system and NVDA as screen reader. The tests were run using different web browsers: Internet Explorer, Mozilla Firefox, Google Chrome and Opera. As before, the RASH+evoGraphs extension works better than the RASH+D3 extension again. Actually, RASH+D3 with this configuration behaved even worse than before, since it presented a partial compliancy with Q2 also when using Internet Explorer.

Test Explorer Firefox Chrome Opera

1 (D3)

-

-

-

-

1 (eG)

+

+

+

+

2 (D3)

~

~

~

~

2 (eG)

+

+

+

+

3 (D3)

+

+

+

+

3 (eG)

+

+

+

+

4 (D3)

-

-

-

-

4 (eG)

+

+

+

+

5 (D3)

3 and 6

3 and 6

3 and 6

3 and 6

5 (eG)

+

+

+

+

Microsoft Windows + NVDA

shows the outcomes of the tests involving Mac OS X as operating system and VoiveOver as screen reader (built-in within the operating system). The tests were run using different web browsers: Apple Safari, Google Chrome, and Opera – and, as previously discussed, we did not use Mozilla Firefox due to its critical accessibility issues within Max OS X. The results obtained are aligned to those already presented in , and even in this case the RASH+evoGraphs extension works better than the RASH+D3 extension again – which present identical issues to those highlighted before.

Test Safari Chrome Opera

1 (D3)

-

-

-

1 (eG)

+

+

+

2 (D3)

~

~

~

2 (eG)

+

+

+

3 (D3)

+

+

+

3 (eG)

+

+

+

4 (D3)

-

-

-

4 (eG)

+

+

+

5 (D3)

3 and 6

3 and 6

3 and 6

5 (eG)

+

+

+

Mac OS X + VoiceOver

Considering the outcomes of all the tests, we can notice that the performance of the RASH extensions seems not to be dependent from the operating systems, browsers, and screen readers used in the experiment. An exception is the Windows+Internet Explorer+JAWS combination ( ) which performs slightly better in keyboard accessibility for the RASH+D3 extension, compared with results obtained by the same extension when tested with the other platforms.

While the results presented in the tables do not reflect this explicitly, we can also state that, excluding Internet Explorer, in general JAWS offers a slightly worse screen reader user experience than the one offered by NVDA and VoiceOver when dealing with the RASH+D3 extension. In fact, it reads the content of figures as if no spacing among labels was present at all, thus it provides a data representation that is confusing and hard to understand.

Finally, these outcomes allow us to claim that the use of evoGraphs in the context of RASH documents is a more suitable solution to improve the accessibility of automatically generated graphs from tabular data, even if the developers have no prior knowledge in accessibility issues. Thus, the use and the integration of evoGraphs will be carefully considered in the future official releases of the RASH Framework so as to address these complex accessibility issues.

Conclusions

In this paper, we have presented two extensions of the RASH format that integrates evoGraphs and D3, with the aim of automatically generating graphs from tabular data. We have reported the results of an experiment we have conducted with the aim of evaluating it those graphs are accessible to screen readers users. According to such outcomes, the RASH extension with evoGraphs gave the best results in terms of accessibility.

While the topic discussed in this paper is an important issue to address for making scientific papers more accessible, this is only a smaller part of a bigger picture. This is the case if we consider the even more complex problem of making accessible to screen reader users the scientific content of a document (e.g., including formulas and figures). While some studies and debates have been conducted on this subject, we do not have yet any authoring tool that allows to generate such accessible contents without a deep understanding of the issue and of the different available technologies that could (and should) be used to improve the accessibility of scientific contents. Finding a feasible solution would provide great benefit to a wider audience, which is represented by early scholars, students, and professors with visual impairments. Moreover, an authoring tool to produce such content would support in an effective way even those authors who are not familiar with accessibility technicalities.

We firmly believe that RASH has a great potential in this area and could be leveraged both by students and educators in different education grades ranging from early scholarship to academic courses as an important tool to produce scientific contents in a way that is visually appealing and accessible at the same time. Thus, our future research efforts will focus on making RASH more suitable for this purpose, by including evoGraphs within the RASH Framework and by either developing or extending existing approaches for dealing with mathematical contents in an accessible way.

This paper is also available in RASH at https://w3id.org/people/essepuntato/papers/rash-ads2017.html.

Acknowledgments

The authors want to thank Ather Sharif, who is the main contributor of evoGraphs, and Andrea Zamberletti and Riccardo Pezzolati, for their precious support in integrating evoGraphs and D3 in RASH.

References

  1. Caldwell, B., Cooper, M., Guarino Reid, L., Vanderheiden, G. (2008). Web Content Accessibility Guidelines (WCAG) 2.0. W3C Recommendation 11 December 2008. https://www.w3.org/TR/WCAG20/

  2. Diggs, J., Craig, J., McCarron, S., Cooper, M. (2015). Accessible Rich Internet Applications (WAI-ARIA) 1.1. W3C Working Draft 19 November 2015. http://www.w3.org/TR/wai-aria-1.1/

  3. International Standard Organisation (2012). ISO 14289-1:2014 - Document Management Applications - Electronic Document File Format Enhancement for Accessibility - Part 1: Use of ISO 32000-1, PDF/UA-1. http://www.iso.org/iso/home/store/catalogue_ics/catalogue_detail_ics.htm?csnumber=64599

  4. U.S. Rehabilitation Act Amendments (1998). Section 508. Available at: http://www.webaim.org/standards/508/checklist

  5. Italian Parliament (2004). Law nr. 4 – 01/09/2004. The Stanca Act. Official Journal nr. 13 – 01/17/2004, January 2004. Available at http://www.camera.it/parlam/leggi/04004l.htm

  6. Brady, E., Zhong, Y., Bigham, J.P. (2015) Creating accessible PDFs for conference proceedings. In Proceedings of the 12th Web for All Conference (W4A 2015), ACM, pages 34-37.

  7. Mirri, S., Muratori, L.A., Salomoni, P. (2011). Monitoring accessibility: large scale evaluations at a geo-political level. In Proceedings of the 13th International ACM SIGACCESS Conference on Computers and Accessibility (ASSETS 2011): 163-170. New York, New York, USA: ACM. http://dx.doi.org/10.1145/2049536.2049566

  8. Armano, T., Capietto, A., Illengo, M., Murru, N., Rossini, R. (2014). An overview on ICT for the accessibility of scientific texts by visually impaired students. In Proceedings of the SIREM–SIE–L Conference 2014: 119-122.

  9. Sorge, V., Cervone, D., Krautzberger, P. (2016). Employing Semantic Analysis for Enhanced Accessibility Features in MathJax. In Proceedings of the 13th IEEE International Conference on Consumer Communications and Networking Conference (CCNC 2016). Washington, District Columbia, USA: IEEE.

  10. Sorge, V., Lee, M., Wilkinson, S. (2015). End-to-end solution for accessible chemical diagrams. In Proceedings of the 12th Web for All Conference (W4A 2015). New York, New York, USA: ACM. http://dx.doi.org/10.1145/2745555.2746667

  11. Lazar, J., Allen, A., Kleinman, J., Malarkey, C. (2007). What frustrates screen reader users on the web: A study of 100 blind users. International Journal of Human-Computer Interaction, 22 (3): 247-269. http://dx.doi.org/10.1080/10447310709336964

  12. Di Iorio, A., Nuzzolese, A. G., Osborne, F., Peroni, S., Poggi, F., Smith, M., Vitali, F., Zhao, J. (2015). The RASH Framework: enabling HTML+RDF submissions in scholarly venues. In Proceedings of the poster and demo session of the 14th International Semantic Web Conference (ISWC 2015). http://ceur-ws.org/Vol-1486/paper_72.pdf

  13. Sharif, A., Forouraghi, B., Gong, S. (2015). evoGraphs - A jQuery Plugin to Create Web Accessible Graphs. In Proceedings of The Graphical Web Conference 2015.

  14. Bostock, M., Ogievetsky, V., Heer, J. (2011). D3 Data-Driven Documents. IEEE Transactions on Visualization and Computer Graphics, 17 (12): 2301-2309. http://dx.doi.org/10.1109/TVCG.2011.185 D³ Data-Driven Documents. IEEE Trans. Vis. Comput. Graph. 17(12): 2301-2309 (2011)

  15. Cooper, M., Kirkpatrick, A., O'Connor, J. (2014). PDF Techniques for WCAG 2.0. W3C Working Group Note 8 April 2014. https://www.w3.org/TR/2014/NOTE-WCAG20-TECHS-20140408/pdf.html

  16. Drümmer, O., Chang, B. (2014). PDF/UA in a Nutshell: Accessible documents with PDF. Online available at: http://www.pdfa.org/publication/pdfua-in-a-nutshell/

  17. Uebelbacher, A., Bianchetti, R., Riesch, M. (2014). PDF Accessibility Checker (PAC 2): The First Tool to Test PDF Documents for PDF/UA Compliance. In Computers Helping People with Special Needs: 197-201. Cham, Switzerland: Springer. http://dx.doi.org/10.1007/978-3-319-08596-8_31

  18. Capadisli, S., Guy, A., Auer, S., Berners-Lee, T. (2015). dokieli: decentralised authoring, annotations and social notifications. http://csarven.ca/dokieli (last visited September 30, 2016)

  19. Lin, T. T. Y., Beales, G. (2015). ScholarlyMarkdown Syntax Guide. Guide, 31 January 2015. http://scholarlymarkdown.com/Scholarly-Markdown-Guide.html.

  20. Mirri, S., Prandi, C., Salomoni, P., (2014). A context-aware system for personalized and accessible pedestrian paths. In Proceedings of the IEEE International Conference on High Performance Computing and Simulation (HPCS 2014): 833-840. Washington, District Columbia, USA: IEEE. http://dx.doi.org/10.1109/NGMAST.2014.59

  21. Mirri, S., Prandi, C., Salomoni, P., (2016). Personalizing Pedestrian Accessible Way-finding with mPASS. In Proceedings of the 13th IEEE International Conference on Consumer Communications and Networking Conference (CCNC 2016). Washington, District Columbia, USA: IEEE.

  22. Goncu, C., Madugalla, A., Marinai, S., Marriott, K. (2015). Accessible on-line floor plans. In Proceedings of the 24th International Conference on World Wide Web (pp. 388-398). International World Wide Web Conferences Steering Committee.

  23. Ferretti, S., Mirri, S., Prandi, C., Salomoni, P., (2015). Automatic web content personalization through reinforcement learning. Journal of Systems and Software (November 2016), volume 121: 157-169.

  24. Salomoni, P., Prandi, C., Roccetti, M., Nisi, V., and N. Jardim Nunes (2015). Crowdsourcing Urban Accessibility:: Some Preliminary Experiences with Results. In Proceedings of the 11th Biannual Conference on Italian SIGCHI Chapter (CHItaly 2015), ACM, 2015, pp. 130-133.

  25. Ferres, L., Verkhogliad, P., Lindgaard, G., Boucher, L., Chretien, A., Lachance, M. (2007, October). Improving accessibility to statistical graphs: the iGraph-Lite system. In Proceedings of the 9th international ACM SIGACCESS conference on Computers and accessibility (pp. 67-74). ACM.

  26. Garrish, M., Siegman, T., Gylling, M., McCarron, S. (2015). Digital Publishing WAI-ARIA Module 1.0. W3C Working Draft 19 November 2015. https://www.w3.org/TR/dpub-aria-1.0/

  27. Di Iorio, A., Peroni, S., Poggi, F., Vitali, F. (2014). Dealing with structural patterns of XML documents. Journal of the American Society for Information Science and Technology, 65(9): 1884–1900. http://dx.doi.org/10.1002/asi.23088

  28. Constantin, A., Peroni, S., Pettifer, S., Shotton, D., Vitali, F. (2016). The Document Component Ontology (DoCO). Semantic Web, 7 (2): 167-181. http://dx.doi.org/10.3233/SW-150177

  29. Di Iorio, A., Gonzalez-Beltran, A., Osborne, F., Peroni, S., Poggi, F., Vitali, F. (2016). It ROCS! The RASH Online Conversion Service. To appear in the Companion Volume of the Proceedings of the 25th International World Wide Web Conference (WWW 2016). OA version available at https://rawgit.com/essepuntato/rash/master/papers/rash-poster-www2016.html

  30. WebAIM Screen Reader Survey #6 results. http://webaim.org/projects/screenreadersurvey6/ (last visited September 30, 2016)

  31. NVDA and Windows 10, 2015 http://www.nvaccess.org/win10/

  32. Usage of Web Browsers. https://en.wikipedia.org/wiki/Usage_share_of_web_browsers (last visited September 30, 2016)

Please refer to the official RASH documentation, available at https://rawgit.com/essepuntato/rash/master/documentation/index.html, for a complete introduction of all the elements and attributes that can be used in RASH documents.